
Stop Relying on Expert Rankings: Build Your Own ’26 Fantasy Projections
June 7, 2026

Welcome back to the Heater Dynasty Podcast! Want to build your own fantasy football projections and stop relying on expert rankings? Today we are diving deep into my 2026 Season-Long NFL Player Projections Template. With the NFL schedule finally released, we can now plug in bye weeks and the final details needed to dominate your league.
Whether you have already purchased the template or you are just looking for a guide on how to build your own projections from scratch, this tutorial will walk you through the process of taking control of your fantasy football data, and stop relying on expert rankings alone.
——————————————————————————–
Step 1: Setting Up and Automating Your Rosters

The first thing you will notice when opening the tool is a yellow bar at the top of the document. You must click “allow access” to enable the web-scraping feature.
This tool pulls live roster and depth chart data directly from ourlads.com, a site known for updating quickly after NFL transactions. By allowing access, you won’t have to manually adjust your sheets every time a player is traded or cut during the preseason—the document handles it for you. Because it is a large file pulling from many sources, give it a moment to populate the team pages.
——————————————————————————–
Step 2: Customizing Your League Scoring
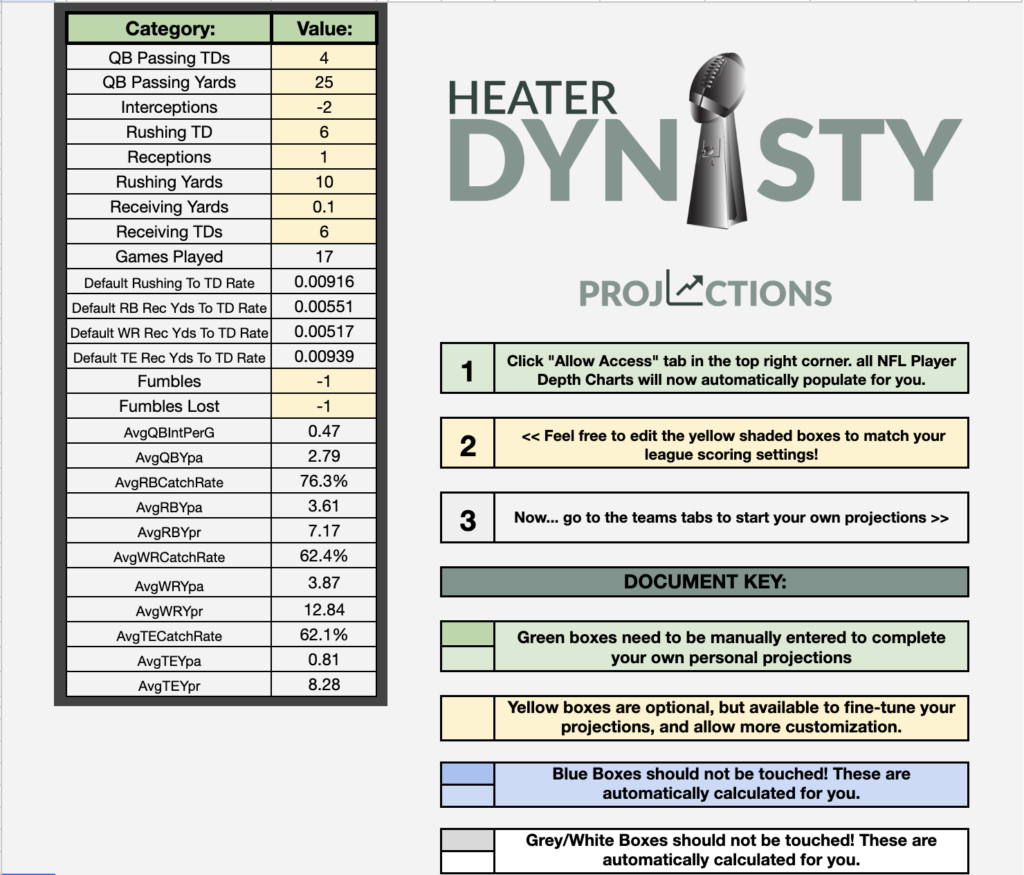
Every fantasy league is different, and your projections should reflect that. In the League Settings tab, you can edit any of the yellow-shaded boxes to match your specific format, whether it is redraft, dynasty, or best ball.
Key settings you can adjust include:
- Passing Touchdowns: 4-point vs. 6-point.
- Receptions: Half-PPR vs. Full PPR.
- Turnovers: Custom values for interceptions and fumbles.
Pro Tip: Fill out all your player projections first, then save multiple copies of the document labeled for different scoring formats (e.g., “Full PPR Projections”) to see how rankings shift. Do not touch the gray-shaded boxes, as these contain the algorithms—such as the five-season average used to create a baseline for rookie touchdown rates.
——————————————————————————–
Step 3: High-Level Team Projections
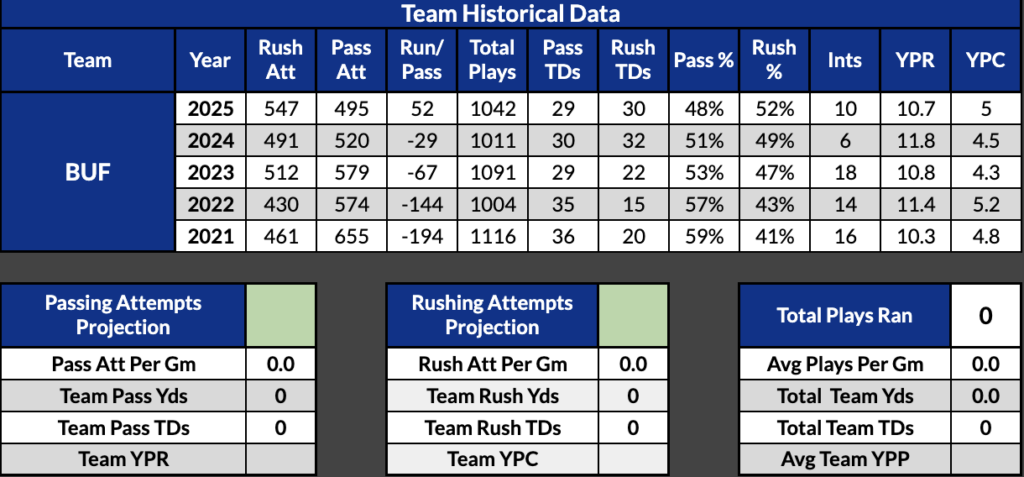
Before looking at individual players, you must determine the “size of the pie” for each team. Start by reviewing the last five years of team data provided in the template.
For example, when projecting the Buffalo Bills, you might look at their historical trends and project them for 500 passing attempts and 550 rushing attempts. The tool will then automatically calculate the projected attempts and plays per game for that squad.
——————————————————————————–
Step 4: Allocating the “Pie” (Carry Split & Target Share)

Once the team totals are set, you move to the player level. You will need to fill out the Carry Split and Target Share for every relevant player.
- The Golden Rule: At the bottom of these columns, you will see a “percentage remaining” box. You want this to hit 0%.
- Avoid the Red: If the box turns red with a negative number, you have projected more stats than the team has available.
- Use Placeholders: If a player like Frank Gore is on the roster but might be cut, treat that slot as a placeholder for whoever ends up as the RB4 on the depth chart.
——————————————————————————–
Step 5: Fine-Tuning with Manual Overrides

The template automatically populates data based on historical trends, but you have the power to override anything using the yellow boxes.
Adjusting for Injuries and Efficiency

The tool defaults to a 17-game season for players with a healthy track record, like Josh Allen. However, if you want to be conservative, you can manually change a player to 15 games, and the tool will instantly recalculate their season-long points. You can also override:
- Interceptions and Fumbles: If you think a QB will be more careful with the ball this year.
- Yards Per Carry/Catch: If you anticipate a change in efficiency.
- Catch Percentage: For instance, if a receiver like DJ Moore is getting a significant upgrade in quarterback play, you might manually bump his catch percentage higher than his historical average.
Handling Rookies
Since rookies have no NFL historical data, the tool cannot autopopulate their stats. You must manually enter their projected games played in the blue boxes to see their fantasy point projections.

——————————————————————————–
Step 6: Reviewing Your Results
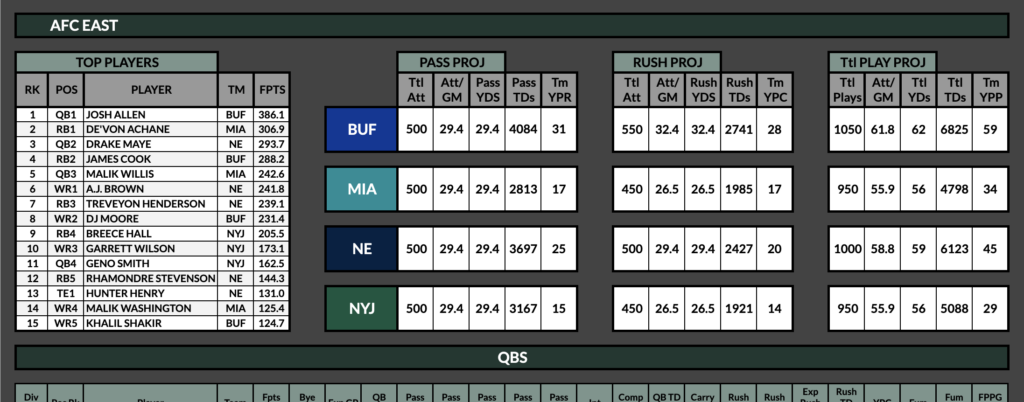
After you’ve finished entering data for the NFL teams, visit the Division Tabs (e.g., AFC East). This allows you to “proofread” your work by looking at the division as a whole. It’s a great way to ensure your personal bias isn’t making your favorite players look unrealistically dominant compared to their peers.
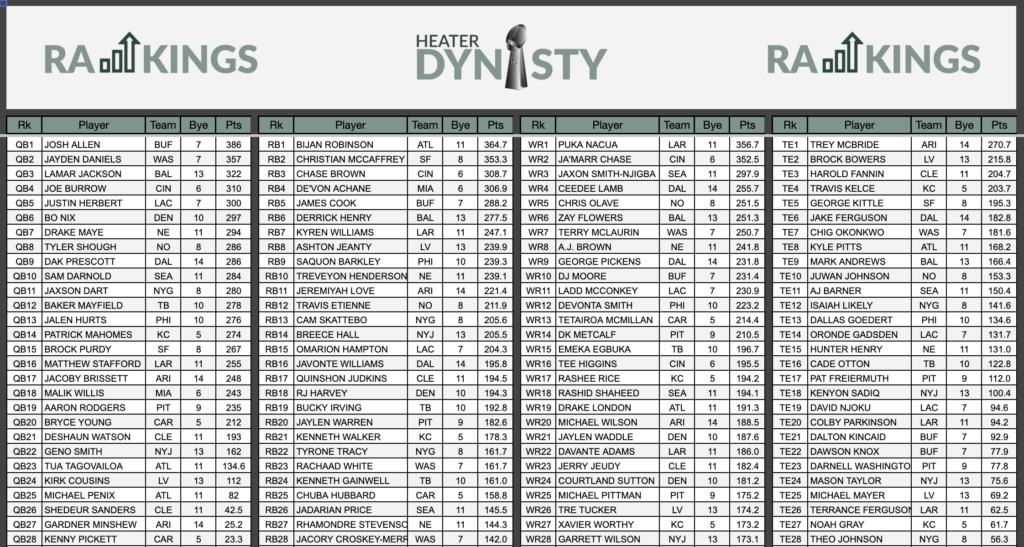
Finally, check your Draft Day Cheat Sheet. This page automatically ranks players by position based on the custom projections you just built, giving you a personalized roadmap for your upcoming drafts.
——————————————————————————–
Get Started Today!
Building your own projections is the best way to move beyond “expert” consensus and develop a true edge in your leagues. If you have questions or want to grab the template, reach out via my website, join my Patreon, or subscribe on YouTube and Spotify.
Good luck this season! And whatever you do, stop relying on expert rankings!
Add a comment
0 Comments